
As per the latest power generation figures released by the Central Electricity Authority,[1] the hydropower generation during the current Financial Year 2016-17 is likely to be lower than the previous year’s generation even though the installed capacity has gone up. Average generation per MW of hydro capacity in India in 2016-17 is likely to be about 30% less power than what our average generation was in 1994-95. More worryingly, the hydropower generated per MW installed capacity continues its downward slide, the downward slide has been going on for now over two decades.
The governments and power sector establishment in India have been pushing Large Hydro projects as if they are good in themselves. Power minister Piyush Goel has been advocating for fresh subsidies to push ahead the stalled large hydropower projects and renewable status for large hydro projects. See the graph below that shows the rapid increase in installed capacity of large hydro projects in India[2]. A huge additional 13182 MW capacity of large hydropower projects are under construction and even bigger capacity is under various stages of approval and planning.
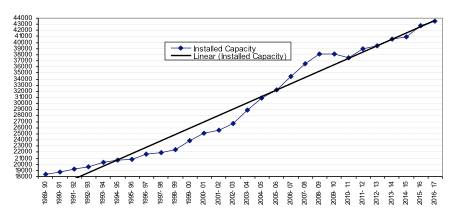
Generation Performance However, there has been no attempt at credible performance appraisal of hydropower projects in India. SANDRP has been analysing power generation performance of large hydropower projects of India for some years. In the graph given below we have plotted the Million Units (MU, one unit is equal of one kilowatt hour of power) electricity generated per Mega Watt (MW) installed capacity of all operating hydropower projects in India. We have done this based on the official data from Central Electricity Authority for total annual power generated by all existing operating large hydropower projects of India and total installed capacity of such projects, for each of the last 24 years from 1993-94. The total installed capacity of large (installed capacity over 25 MW) hydro projects in India as on Jan 31, 2017 is 43539 MW, up from 18308 MW in 1989-90.
The graph below also shows the trend line of power generation of Big Hydropower projects for the last 20 years, it is clear the trend-line shows diminishing generation from existing hydro power projects of India.

- It shows that per MW generation in 2016-17 has dropped by about 30% from the generation figure for 1993-94. This should be a matter of serious concern, but the CEA, Power Ministry or none of the other bodies are doing such an analysis. Such an analysis can also help us try and understand why this is happening and what needs to be done to arrest the decline or reverse this trend. The falling generation cannot be attributed to lower monsoon rainfall, since rainfall has been average or above average in most of the years under consideration.
Monsoon Rainfall
| Year | Monsoon Rainfall |
| 1993 | 101 % |
| 1994 | 110 % |
| 1995 | 100 % |
| 1996 | 103 % |
| 1997 | 102 % |
| 1998 | 106 % |
| 1999 | 96 % |
| 2000 | 92 % |
| 2001 | 92 % |
| 2002 | 81 % |
| 2003 | 102 % |
| 2004 | 87 % |
| 2005 | 99 % |
| 2006 | 99 % |
| 2007 | 106 % |
| 2008 | 98 % |
| 2009 | 78 % |
| 2010 | 102 % |
| 2011 | 102 % |
| 2012 | 93 % |
| 2013 | 106 % |
| 2014 | 88 % |
| 2015 | 86 % |
| 2016 | 97 % |
What we can see from these monsoon rainfall figures from India Meteorological Department[3] is that in 13 of the 22 years the rainfall was above or near normal (above 97% of normal), so one cannot say that the diminishing generation is due to below normal monsoon.
89% projects are underperforming A separate analysis showed that 89% of the hydropower projects generate at below the design or promised generation level at 90% dependability. Each large hydro project is given techno economic clearance by CEA based on a promise at appraisal stage that the project will generate certain amount of power in 90% of the years. When we compared that figure with the actual generation figure for the last 29 years for each of the operating projects, we found that 89% have been under-performing. And among the under performing projects, 50% were generating below the 50% of the promised power generation. And yet no questions are asked, no accountability fixed, in fact such an analysis is not even done by the official agencies. This means, for example that a lot of the projects that are being set up now are UNVIABLE projects or that the installed capacities are way above optimum levels.
The reasons There are many reasons why the generation per MW is dipping: unviable projects, unviable installed capacities, over-optimistic hydrological assumptions, over development (development beyond the carrying capacity of the basin), catchment degradation, high rates of sedimentation, inadequate Repair & Maintenance, Run of River projects (this phrase is a misnomer, these projects do not generate power from the run of the river but through a dam and a tunnel), changing monsoon patterns due to climate change, increasing groundwater use, etc.
Here it should be added that the factors like the destruction of forests, rivers, fisheries, biodiversity and submergence of lands, all contributed by hydropower projects are also making the impact of climate related disasters worse for the people and also for the hydropower projects, as could be seen during the June 2013 Uttarakhand disaster. All this needs to be part of our impact assessment and decision making process, which is not the case today.
MONTHLY GENERATION The bar chart below provides monthly power generation from hydropower projects at all India level during 2014-15, to illustrate the generation pattern from hydropower projects across the year. The chart shows that the maximum power in hydro sector (36.3% of annual generation) happens during three monsoon months of July-Sept. During six months of May-Oct, 63.7% of annual generation happens and during the remaining six months, only about 36.3% generation happens, February has the lowest generation.

There is no doubt that more detailed state wise, basin wise, type wise, age wise, etc analysis would help, some of which are available in “Hydropower Performance” section of SANDRP website[4]. However, to continue to push large hydro without such informed analysis would only lead to bad decisions, leading to avoidable social, environmental, economic and opportunity costs.
Power Surplus situation: an opportunity Currently, India is in power surplus situation[5], even if notional but real, as is evident from a number of facts, including the every 15 minute snapshot of power situation at Vidyutpravah.in, decreasing plant load factors of thermal power projects (not due to lack of coal, there is excess coal available with thermal power projects), decreasing price of power at power exchanges, no new PPAs (Power Purchase Agreement) getting signed for almost two years and even operating solar power projects are sometimes asked to back down[6]. Similarly wind power projects are also asked to back down and both solar and wind power producers are facing delay in payments by discoms[7]. With rapidly increasing solar and wind power capacities, increasing end use efficiencies and reducing T&D losses, this situation is going to continue for foreseeable future. The cost hydro at over Rs 10 crore per MW installed capacity, even without adding the social and environmental costs, mostly unaccounted, is much higher than the solar power cost. This situation of surplus power provides an opportunity for us to take pause and stop pushing large hydropower capacities.
There are options Considering the diminishing returns from existing hydropower capacity and serious underperformance from 89% of existing projects, the first priority should be to optimise generation from existing projects instead of pushing for new large hydro projects. There is a lot that we need to do here. We are also not doing advance comprehensive project level or basin wide cumulative social and environmental impact assessments, nor getting public consent in upstream and downstream areas.
Even for ensuring power to those that do not have access to power now, there is also a huge potential of sub MW capacity hydro projects in most of the Himalayan and other mountain areas, besides the roof top solar option. These projects would have least costs, least impacts, and could be implemented in short time with full involvement of the benefiting local communities. Such projects should be a priority before taking up larger projects.
As global trends show, more solar and wind power based installed capacity is now being added than in any other sector. This is also likely to be the trend in India in future since cost of solar and wind based generation is going done, while cost of hydropower projects, already above those of solar, is going up. Today, the 46327 MW of installed capacity of renewable electricity in India[8] is already way above the 43539 MW of capacity from large hydro. Capacity addition through grid connected solar power (4769 MW) since April 2015 has been more than double the capacity added through large hydro (2227 MW).
Pump storage hydro However, one of the obstacles in this regard is that the solar and wind power is only available during day time or wind hours respectively and storage of surplus (over and above what the grid can consume) power generated during such time is costly and difficult to store. The pump storage hydro projects can provide an option in this regard even at existing dams. In such projects, a small lower dam can be used to create a pump storage facility at existing dams. Thus surplus power during day time and wind hours can be used to pump water from lower (smaller) reservoir to upper (larger existing) reservoir of such projects. During night and off wind hours, this water than be released from upper to lower reservoir to turn the same turbines to generate power. This option needs to be explored.
No one is assessing peaking power from hydro projects One of the USPs (Unique Selling Propositions) of hydropower projects is that it can provide peak hour power, which coal based or nuclear power projects cannot provide. However, we do not have the even necessary data to analyse what % of hydropower generation is providing peaking power. What is surprising however is that there is no agency in India that is doing such an analysis. Without such an analysis it is not possible to even start understanding and optimizing the peak hour power generation from hydro projects. Needless to add, such an analysis should also involve assessing the impacts of peaking power generation. The rivers downstream from hydropower projects would face huge fluctuations, twice a day, in flows where the hydropower projects operate as peaking power. The impacts would include those on biodiversity including fisheries, on drawdown agriculture, on safety of the people and cattle, among others.
Depending on site specific conditions, the currently under-utilised peaking power potential of existing hydropower projects can be substantially better utilised before going for new peaking projects, if we can assess and address the impacts of peaking mode operation of the hydropower projects. However, if we are neither monitoring nor trying to optimize peaking power generation, nor are we doing anything for peak hour power demand management, is there a case for pushing more hydro in the name of peaking power demands?
Hydro at existing large dams? Less than 3% of India’s large dams have hydropower component, most of the 97% large dams without hydropower component are irrigation projects. However, in these projects, the social, environmental and economic costs have already been paid. We need to at least assess the possibility of adding hydro component to some of these projects. But such an assessment is not happening at all. United States of America, have been doing exactly that, assessing the possibility of adding hydro component at existing dams and implementing such options rather going for new hydro projects[9]. According to one study, USA can add at least 10000 MW additional hydropower capacity at existing dams. We need to start making the assessments in this regard.
What all this means is that before we go for more hydropower projects, we have a lot of options. We hope that as indicated by this analysis, we take a pause in large hydro and in stead work towards the options indicated here.
Himanshu Thakkar (ht.sandrp@gmail.com), SANDRP, Feb 2017
ANNEXURE:
| YEAR | LARGE HYDRO INSTALLED CAPACITY, MW | MU/MW |
| 1989-90 | 18307.63 | |
| 1990-91 | 18753.42 | |
| 1991-92 | 19194 | |
| 1992-93 | 19576 | |
| 1993-94 | 20275.5 | 3.9 |
| 1994-95 | 20725.5 | 3.97 |
| 1995-96 | 20875.5 | 3.46 |
| 1996-97 | 21658 | 3.168 |
| 1997-98 | 21881.03 | 3.404 |
| 1998-99 | 22443.26 | 3.69 |
| 1999-2000 | 23827.38 | 3.383 |
| 2000-01 | 25141.78 | 2.957 |
| 2001-02 | 25574.03 | 2.893 |
| 2002-03 | 26660.23 | 2.395 |
| 2003-04 | 28925.2 | 2.551 |
| 2004-05 | 30818.3 | 2.74 |
| 2005-06 | 32277 | 3.14 |
| 2006-07 | 34476 | 3.29 |
| 2007-08 | 36468 | 3.39 |
| 2008-09 | 38060 | 2.99 |
| 2009-10 | 38144 | 2.8 |
| 2010-11 | 37467 | 3.05 |
| 2011-12 | 38990 | 3.35 |
| 2012-13 | 39491 | 2.88 |
| 2013-14 | 40524 | 3.32 |
| 2014-15 | 40885 | 3.16 |
| 2015-16 | 42801 | 2.84 |
| 2016-17 (till Jan 2017) | 43539 | 2.77 |
END NOTES:
[1] CEA is a Union Power Ministry’s premier technical body, see: http://cea.nic.in/monthly_gen.html
[2] The slight dip in installed capacity in 2010-11 is because in the capacity monitored by the Central Electricity Authority, the CEA that year excluded some of the small hydro projects (capacity below 25 MW) that were included in its monitoring matrix earlier.
[3] http://www.imd.gov.in/section/nhac/dynamic/Monsoon_frame.htm
[4] https://sandrp.in/HEP_Performance/
[5] See for example: http://vidyutpravah.in/
[6] So much so that in Aug 2016, Joint Secretary in Govt of India’s Ministry of New and Renewable Sources of Energy wrote to Central Electricity Regulatory Commission to do the needful to stop such actions as solar projects are supposed to be in must run status, see: http://mnre.gov.in/file-manager/UserFiles/Backdown-of-solar-projects.pdf. Also, see: http://www.thehindubusinessline.com/news/national/tnerc-seeks-explanation-from-tangedco-on-solar-projects/article9091331.ece
[7] http://www.livemint.com/Industry/ASu58DZtfl5xnomADH13wL/Clean-energy-firms-worry-about-backdown-by-discoms.html
[8] http://pib.nic.in/newsite/PrintRelease.aspx?relid=155612
[9] http://www.hydro.org/policy/waterpower/powering-existing-dams/

It is true that rainfall is not less than normal for the reduced hydro electricity generation/MW capacity but the available water is used for irrigation in the upstream of hydro projects reducing their output. Thus the productivity of old hydro power stations have reduced drastically but new hydro stations coming up in Himalayas would not face water shortage.
In addition to operate the hydro stations for meeting peaking load, the rest of time (.>70%) can also be used as load following power stations to match the frequency fluctuations in the electricity grid. Refer https://en.wikipedia.org/wiki/Load_following_power_plant for more data. This would create more value from the limited water availability.
Presently, the surplus power situation is such that new pumped storage (as expansion of existing hydro stations) units are not economical to convert surplus electricity (nearly 2.5 Rs/kWh) to sell above 3.5 Rs/kWh at 75% net conversion (without any returns on additional investment). The surplus electricity price has to come down further to less than fuel cost (coal/gas/ uranium) of a thermal power station or people/ DisComs should be ready to pay higher price (at least 5 Rs/kWh) during peak hours. They are already paying nearly 5 Rs/kWh for negative load / secondary power from wind power stations. Solar power is presently costing nearly Rs 5/kWh but it is meeting peak load during the day time in non-monsoon months.
Substantial existing operational capacity pumped storage units (Srisailam 900 MW & Nagarjunasagar 700 MW) with a peaking capability of 2480 MW is not utilised due to interstate disputes between newly formed Telangana and AP.states. Thus cheaper surplus power from other reasons is not consumed but costly power from imported coal fired thermal power stations located in southern India. Maharashtra is not operating its Koyna hydro and Tata hydro power stations (nearly 2500 MW) in pumped storage mode as its power availability from the contracted power (must run PPAs with IPPs) is exceeds its peaking load requirement forcing its SEB base load coal power stations to back down during lower power demand.
LikeLike
SANDRP — appreciate knowing the percentage figures in the table monsoon rainfall refer to the what average/normal value? Because there are several average/normal figures are seen in the literature.
Dr. S. Jeevananda Reddy
LikeLike
IMD figures.
LikeLike
What is IMD figure?
sjreddy
LikeLike
What will be the opportunity of the Hydropower Sector in India’s NER
LikeLike
Do we need large hydro? Has anyone asked that question to people of NER?
LikeLike